The morning email, the evening truth — how the business is doing.
You shouldn't have to go looking for your own numbers. Yesterday lands in your inbox each morning — collected, counted, split by tender — and when a number needs a why, the dashboard's six reports carry it: sales, the menu quadrant, profit & loss, expenses, labour. All of it on your trading day, not calendar midnight.
Inbox to deep report — three steps.
Start with the morning email
Every morning, yesterday's business arrives in your inbox: how much was collected, how many orders, the average order, and the cash / UPI / card split — lines that add up to the total exactly, because a summary an owner can't reconcile is worse than none. It goes to everyone who can sign in to your dashboard, it's on by default, and a ₹0 day sends nothing — no news is not sent as news.
Open Summary when a number needs a why
The dashboard's Summary page is the same glance, deeper: net sales, orders, food cost, labour, prime cost and profit as cards with trendlines, a 'Needs attention' queue that turns machine findings into owner language, the dishes moving up and down against last period, and a day-of-week × hour heatmap of net sales — the honest way to decide staffing for Tuesday nights. Every card clicks through to its deep report.
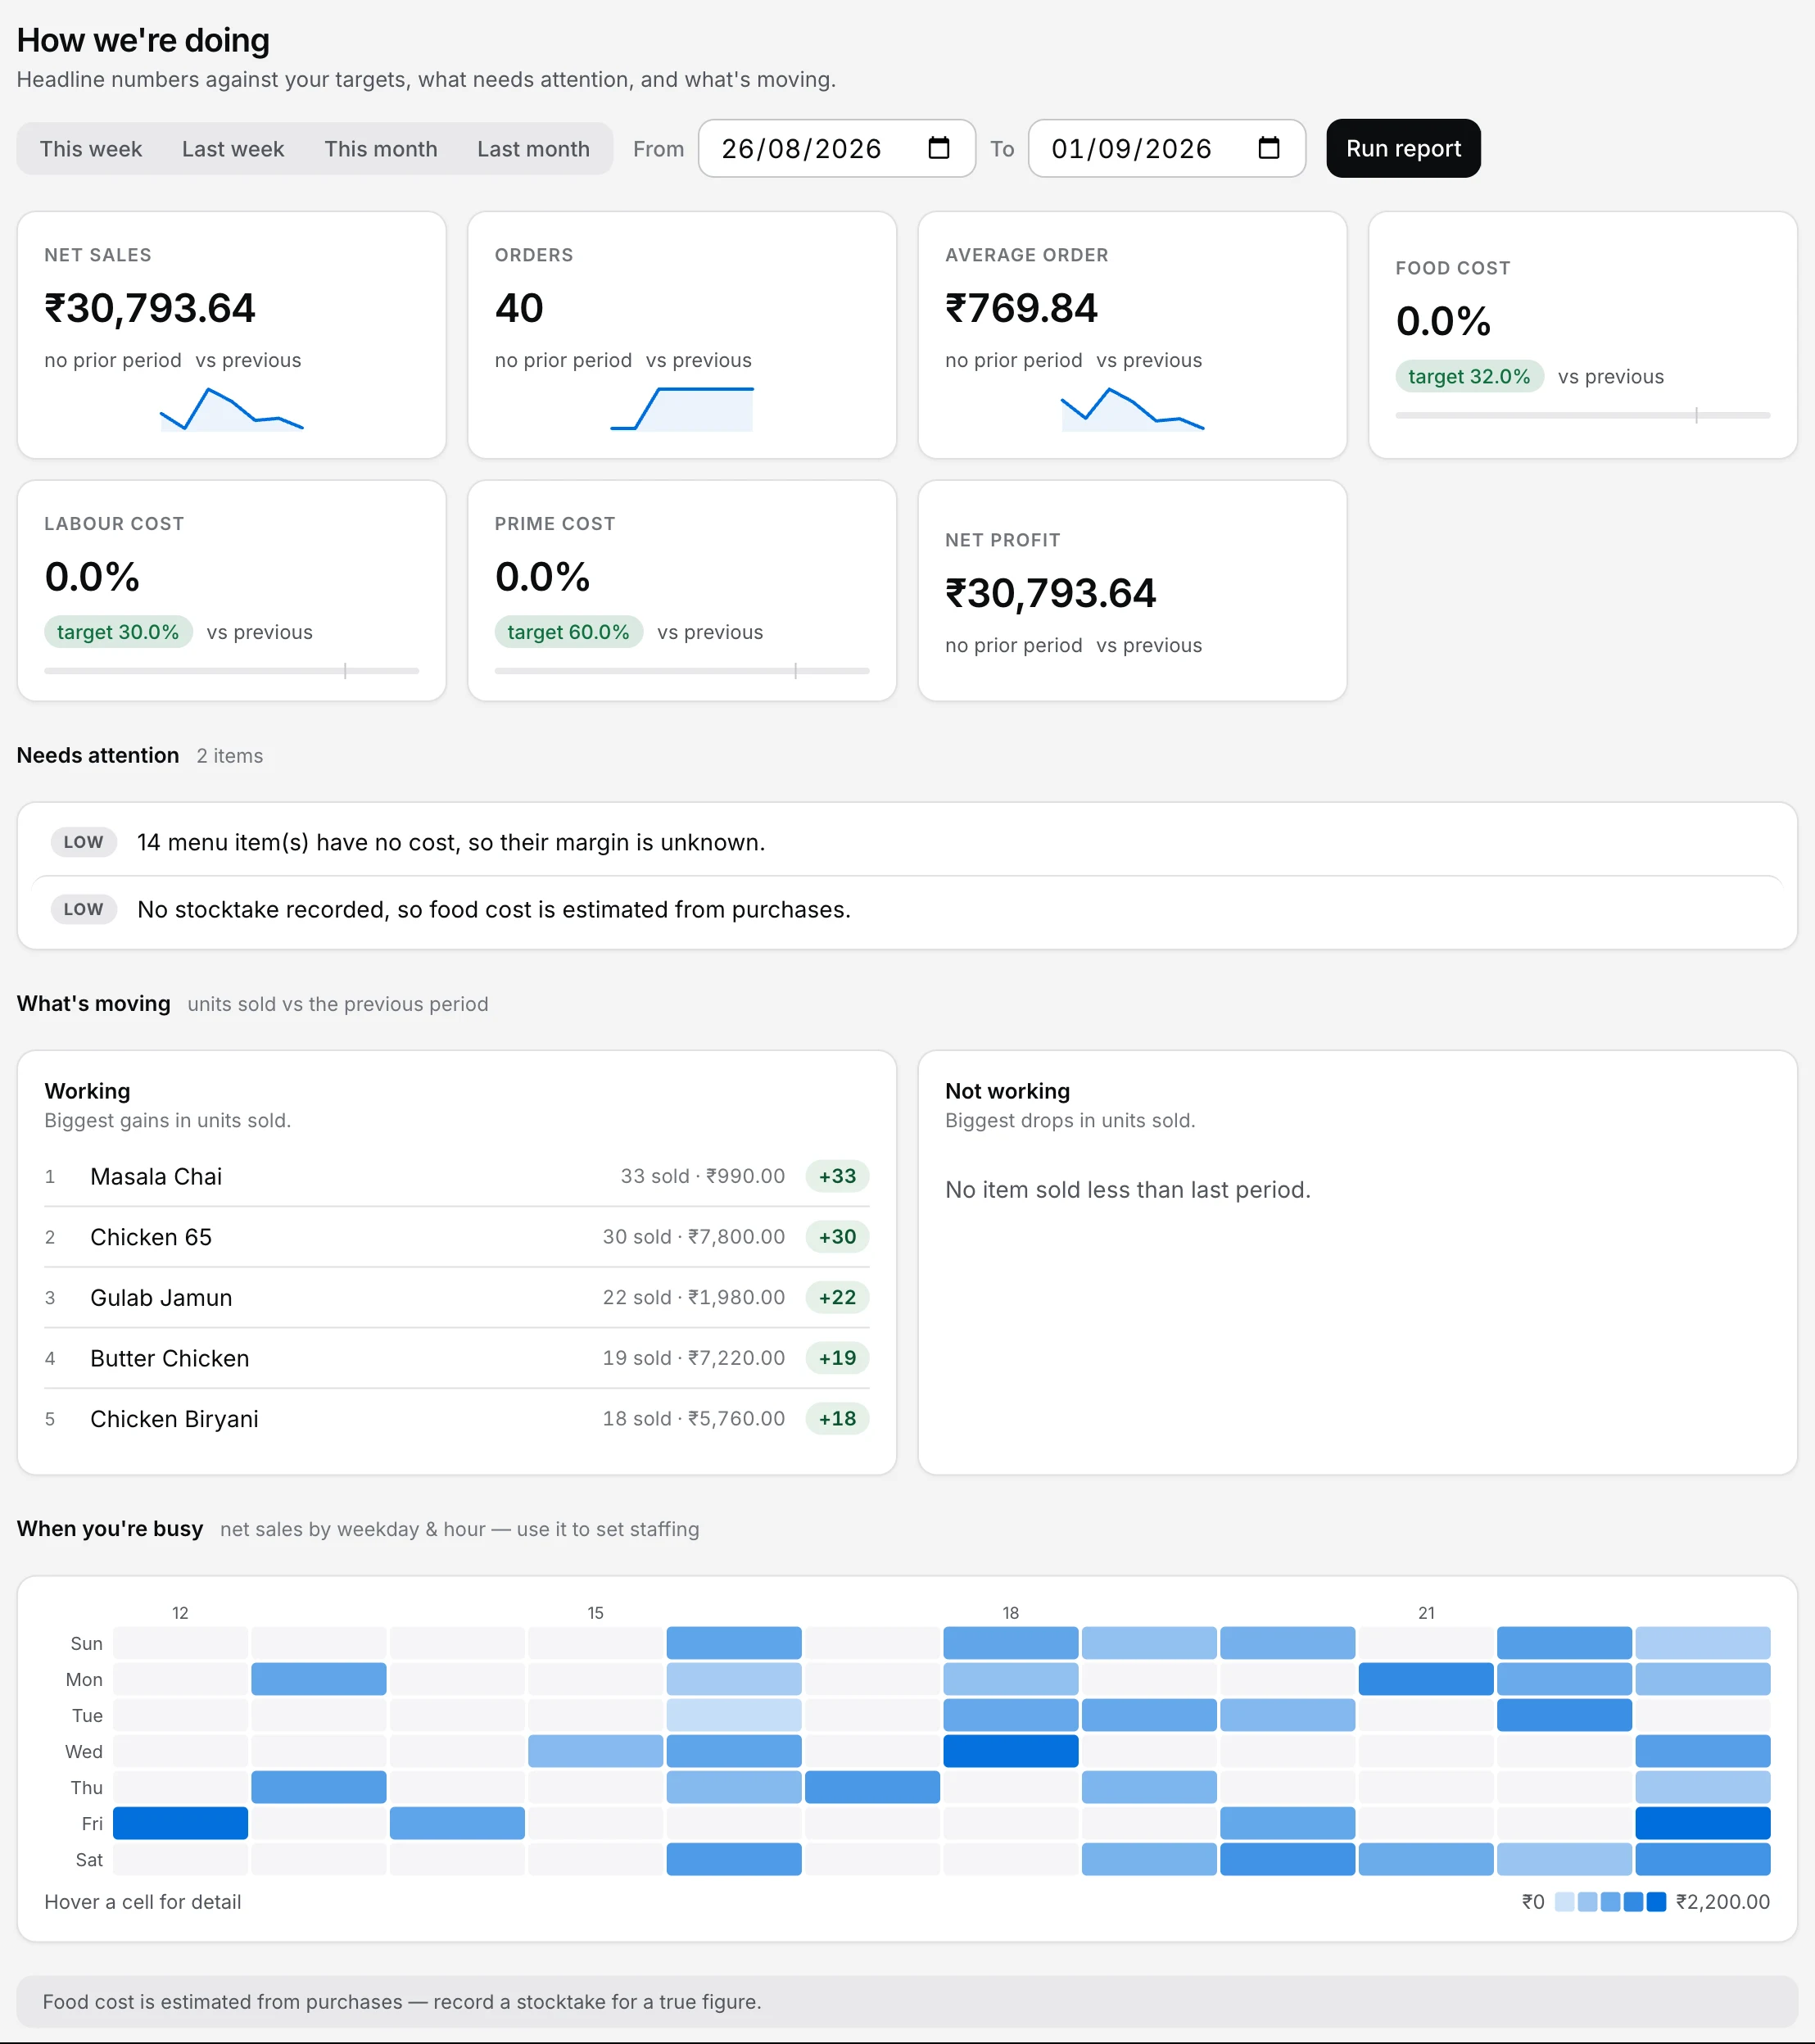
Step 2 — the glance with a why behind every number, and a heatmap that sets Tuesday's staffing.
Use the deep reports for real decisions
Sales breaks down tenders, discounts, refunds and dine-in versus parcel. Menu performance plots every dish into four straight-talking boxes — Stars to protect, Plowhorses to reprice, Puzzles to promote, Dogs to drop. Profit & loss walks net sales down to net profit against the previous period; Expenses and Labour carry the two costs that eat restaurants. Pick your range — this week, last month, or exact dates — and the same picker drives every page.
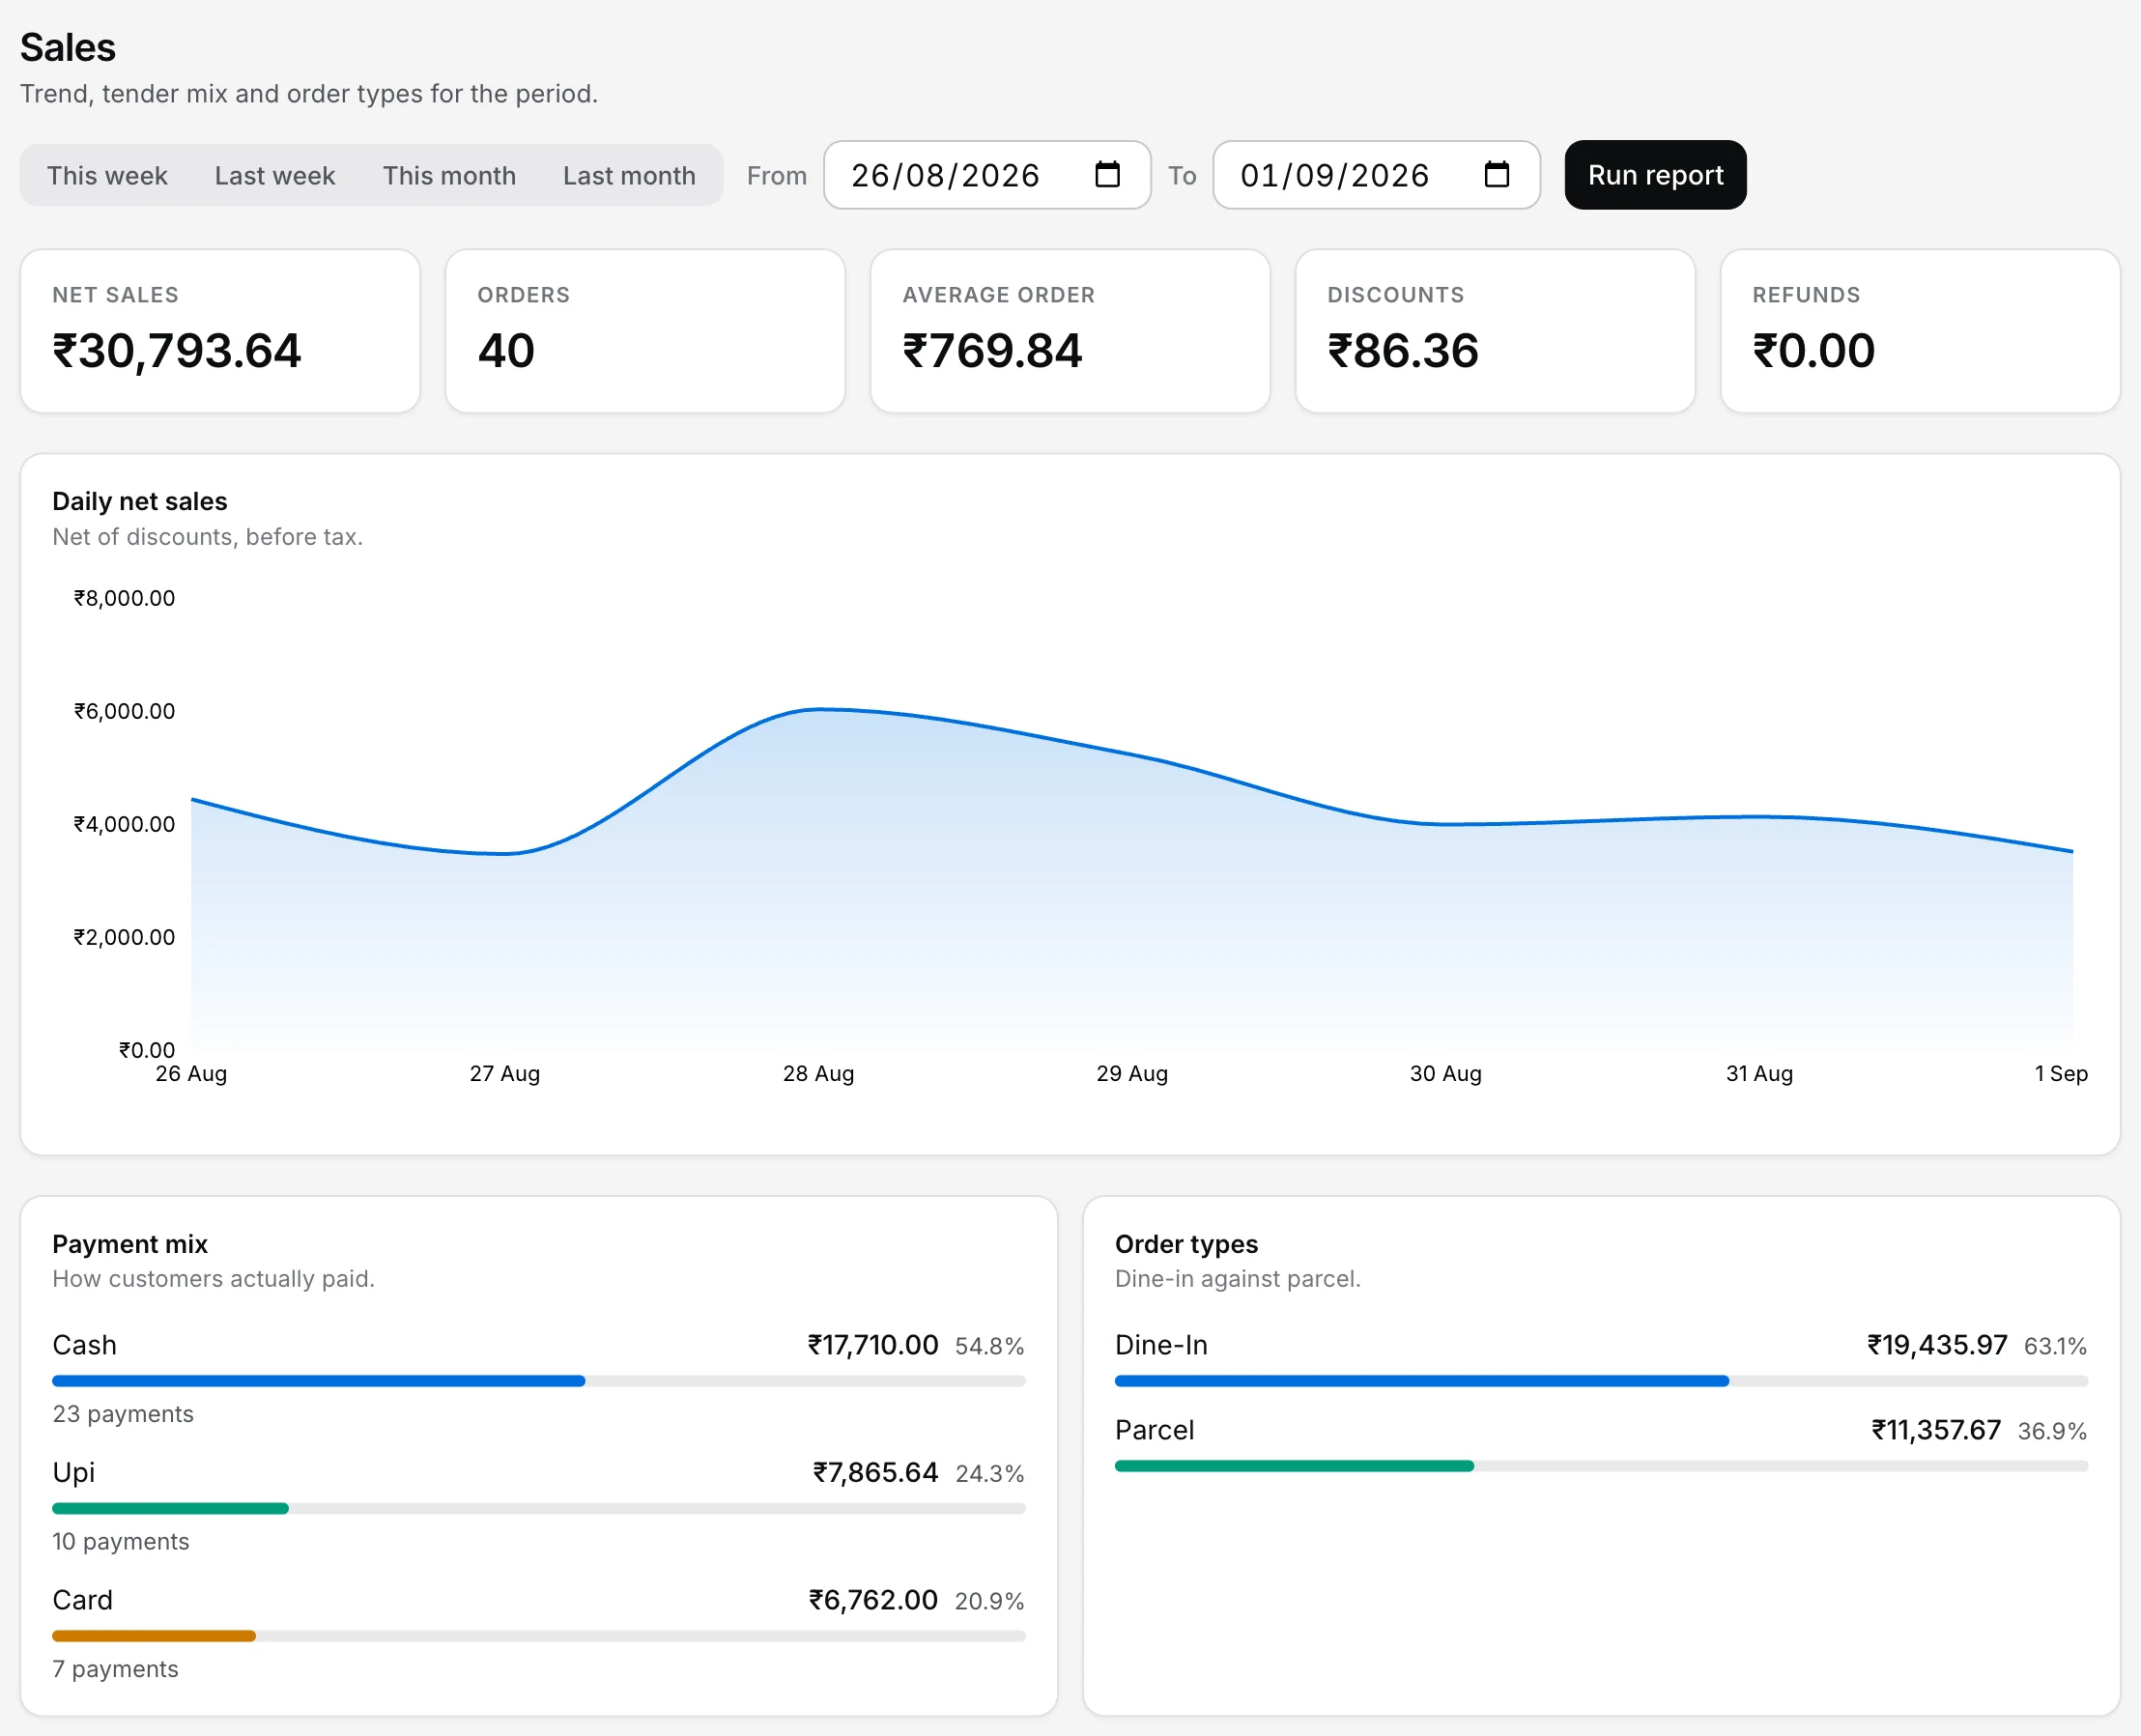
Step 3a — tenders, discounts, refunds, dine-in vs parcel: the day, itemised.
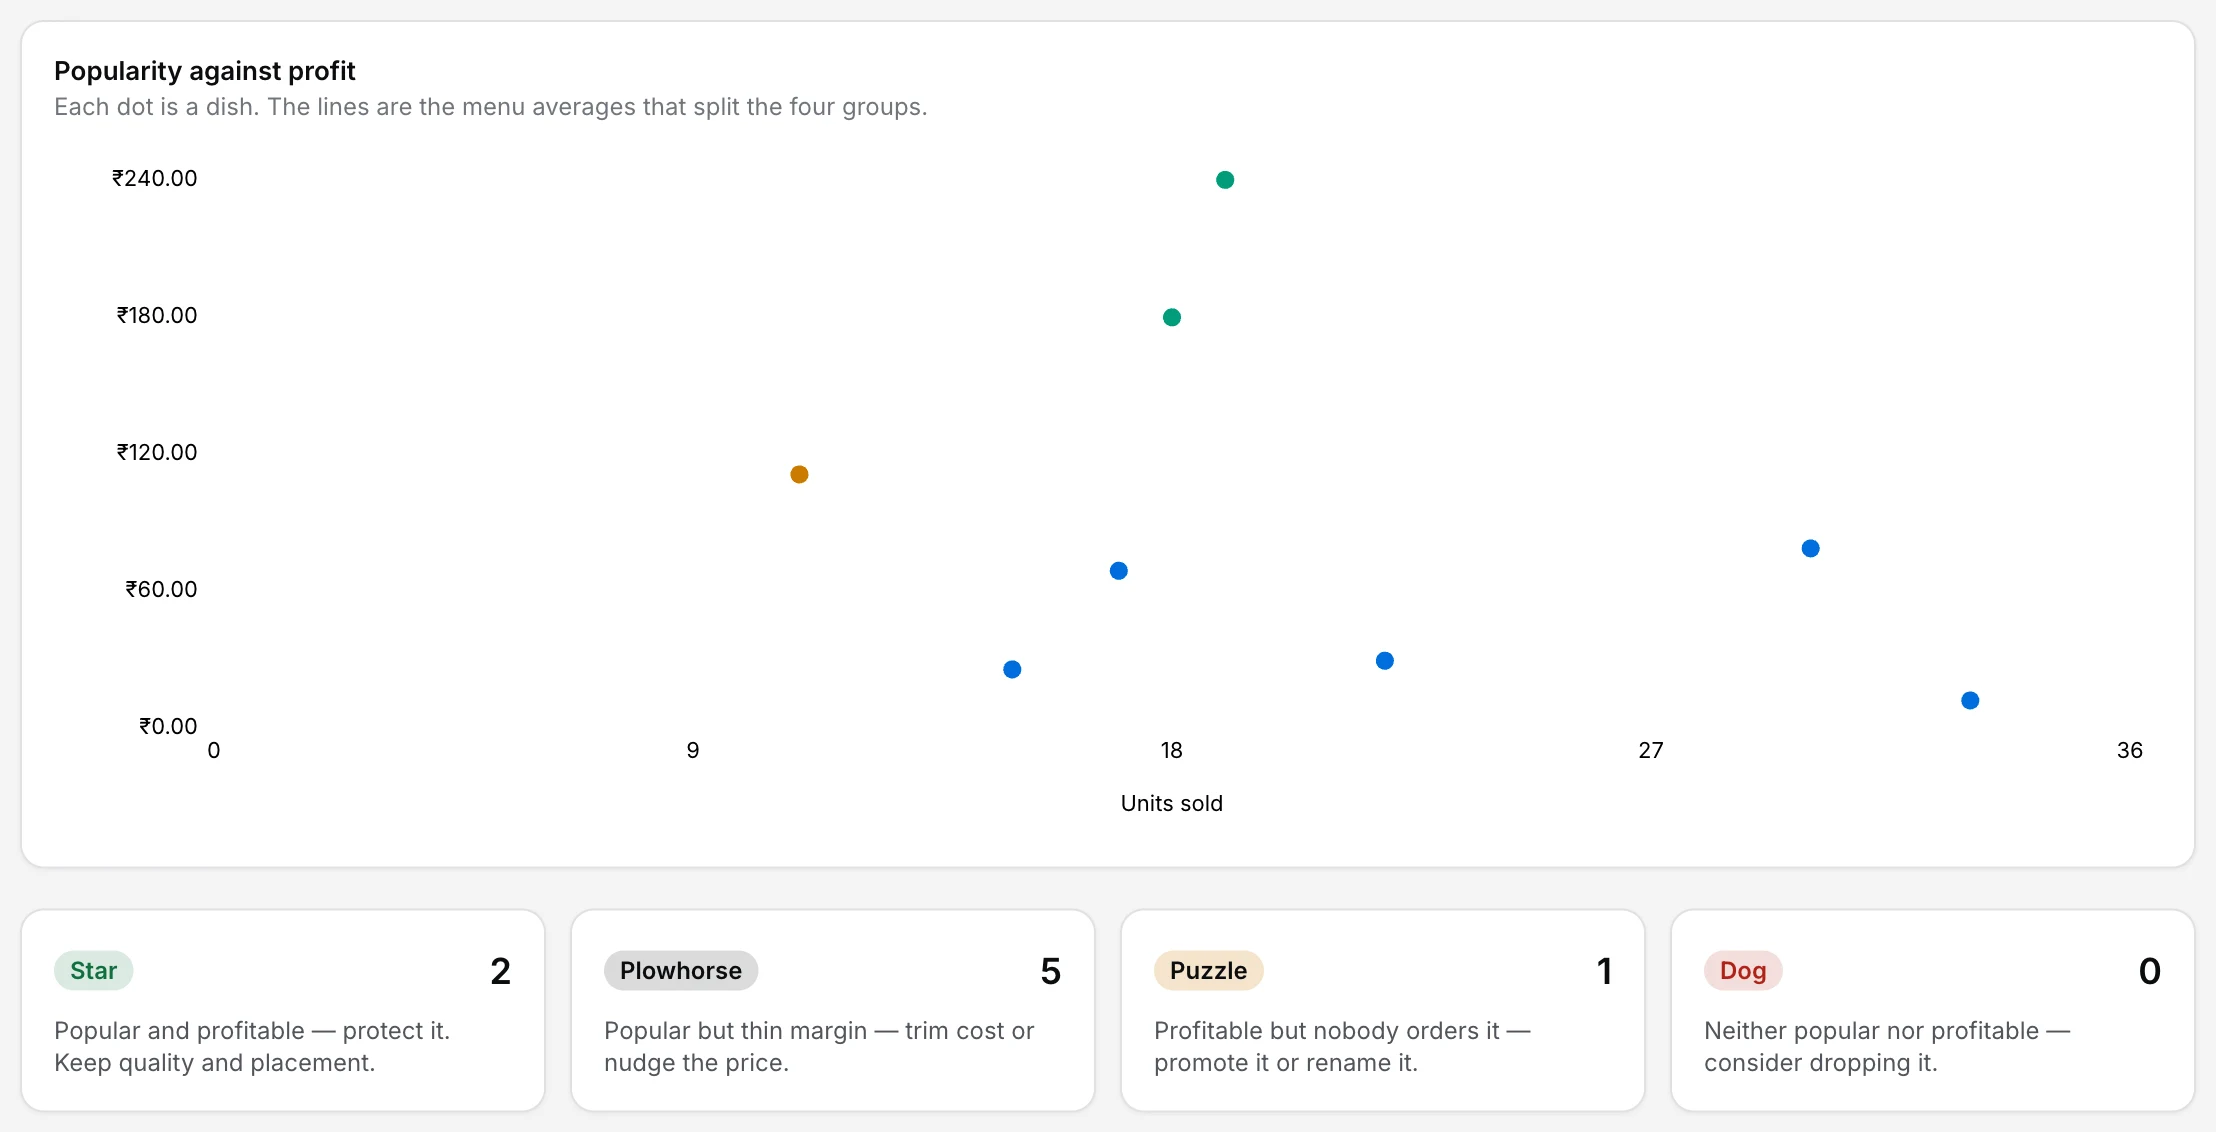
Step 3b — every dish in one of four honest boxes, with the action written beside it.
Turn the email off (or on) yourself: dashboard → Settings → Notifications → "Daily summary". It's on by default, and it goes to every person with dashboard access — the partner sees what you see.
Straight answers.
When does the daily summary email arrive, and what's in it?
Whose 'day' is it — calendar midnight or my restaurant's night?
What is the menu quadrant actually telling me?
Can I download reports as PDF or Excel?
Where do food cost and labour numbers come from?
Feed the numbers.
Closing the day
Clean checks in, clean numbers out — the one-minute night routine.
Close the day →Settling & payments
Where the tender split is born — cash, UPI, card, part pay.
See the settle guide →Getting started
The five signup steps that put this dashboard in your hands.
Start here →Every guide in this cluster is listed on the guides hub.
Run it 3 months, then pay for it.
Three months free, full product, no card. Made in India, for the counter — built inside a running restaurant.